Pollution reductions from EPA Partnership ProgramsThe Clean Air Act has a proven record of public health and environmental protection since 1970.
EPA uses voluntary partnership programs in tandem with regulatory programs to protect public health and the environment. Clean Air Act partnership programs reduce conventional air pollution and greenhouse gas emissions, improve energy efficiency, reduce oil imports, and save money.
Experience with the Clean Air Act since 1970 has shown that protecting public health and building the economy can go hand in hand.
Clean Air Act programs have lowered levels of six common pollutants -- particles, ozone, lead, carbon monoxide, nitrogen dioxide and sulfur dioxide -- as well as numerous toxic pollutants.
These air quality improvements have enabled many areas of the country to meet national air quality standards set to protect public health and the environment. For example, all of the 41 areas that had unhealthy levels of carbon monoxide in 1991 now have levels that meet the health-based national air quality standard. A key reason is that the motor vehicle fleet is much cleaner because of Clean Air Act emissions standards for new motor vehicles.
Airborne lead pollution, a widespread health concern before EPA phased out lead in motor vehicle gasoline under Clean Air Act authority, now meets national air quality standards in most areas of the country.
State emission control measures to implement the Act, as well as EPA's national emissions standards, have contributed to air quality improvements.
A peer-reviewed EPA study issued in March 2011 found that the Clean Air Act Amendments of 1990 are achieving large health benefits that will grow further over time as programs take full effect.
This chart shows the health benefits of Clean Air Act programs that reduce levels of fine particles and ozone.
| Health Effect Reductions (PM2.5 & Ozone Only) | Pollutant(s) | Year 2010 | Year 2020 |
|---|---|---|---|
| PM2.5 Adult Mortality | PM | 160,000 | 230,000 |
| PM2.5 Infant Mortality | PM | 230 | 280 |
| Ozone Mortality | Ozone | 4,300 | 7,100 |
| Chronic Bronchitis | PM | 54,000 | 75,000 |
| Acute Bronchitis | PM | 130,000 | 180,000 |
| Acute Myocardial Infarction | PM | 130,000 | 200,000 |
| Asthma Exacerbation | PM | 1,700,000 | 2,400,000 |
| Hospital Admissions | PM, Ozone | 86,000 | 135,000 |
| Emergency Room Visits | PM, Ozone | 86,000 | 120,000 |
| Restricted Activity Days | PM, Ozone | 84,000,000 | 110,000,000 |
| School Loss Days | Ozone | 3,200,000 | 5,400,000 |
| Lost Work Days | PM | 13,000,000 | 17,000,000 |
Environmental effects of air pollution include damage to plants and long-term forest health, soil nutrient deterioration, accumulation of toxics in the food chain, damage to fish and other aquatic life in lakes and streams, and nitrogen enrichment of coastal estuaries causing oxygen depletion and resulting harm to fish and other aquatic animal populations.
Reducing air pollution also improves crop and timber yields, a benefit worth an estimated $5.5 billion to those industries' welfare in 2010, according to the peer-reviewed March 2011 EPA study. Better visibility conditions in 2010 from improved air quality in selected national parks and metropolitan areas had an estimated value of $34 billion.
EPA’s peer-reviewed 2011 study found that clean air programs established by the 1990 CAA amendments are expected to yield direct benefits to the American people which vastly exceed compliance costs.
The study's central benefits estimate of $2 trillion in 2020 exceeds costs by a factor of more than 30-to-1, and the high benefits estimate exceeds costs by 90 times. Even the low benefits estimate exceeds costs by about 3-to-1.
In addition to direct benefits vastly exceeding direct costs, economy-wide modeling conducted for the study found that the economic welfare of American households is better with post-1990 clean air programs than without them.
Economic welfare and economic growth rates are improved because cleaner air means fewer air-pollution-related illnesses, which in turn means less money spent on medical treatments and lower absenteeism among American workers. The study projects that the beneficial economic effects of these two improvements alone more than offset the expenditures for pollution control.
The EPA report received extensive review and input from the Council on Clean Air Compliance Analysis, an independent panel of distinguished economists, scientists and public health experts established by Congress in 1991.
EPA has required dramatic reductions in emissions from new motor vehicles and non-road engines - such as those used in construction, agriculture, industry, trains and marine vessels -- through standards that require a combination of cleaner engine technologies and cleaner fuels. In 2013, EPA estimated the benefits of five key standards to cut emissions from vehicles, engines and fuel to 2030.

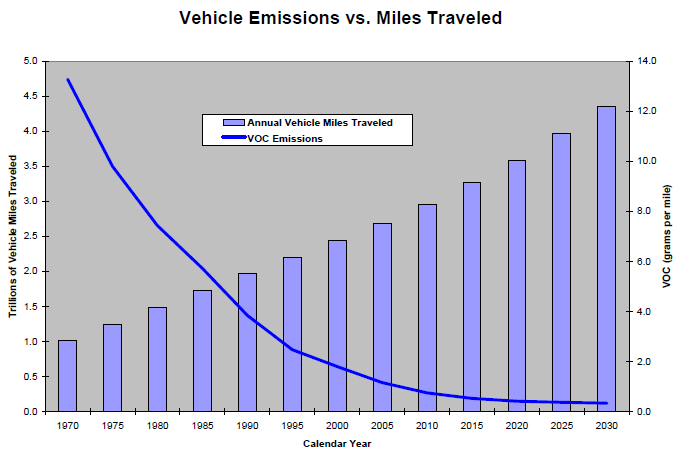
Compared to 1970 vehicle models, new cars, SUVs and pickup trucks are roughly 99 percent cleaner for common pollutants (hydrocarbons, carbon monoxide, nitrogen oxides and particle emissions), while Annual Vehicle Miles Traveled has dramatically increased.
New heavy-duty trucks and buses are roughly 99 percent cleaner than 1970 models. In August 2016, EPA and the U.S. Department of Transportation’s National Highway Traffic Safety Administration (NHTSA) jointly finalized standards for medium- and heavy-duty vehicles that will improve fuel efficiency and cut carbon pollution, while bolstering energy security and spurring manufacturing innovation.
Starting in the 2014 model year, locomotives are 90 percent cleaner than pre-regulation locomotives. In March 2008, EPA finalized a three part program that dramatically reduces emissions from diesel locomotives of all types -- line-haul, switch, and passenger rail. The rule cuts particulate emissions from these engines by as much as 90 percent and nitrogen oxides emissions by as much as 80 percent when fully implemented.
New commercial marine vessels (non-ocean-going) are 90 percent cleaner for particle emissions than in 1970. Clean Air Act and international standards for ocean-going vessel emissions and fuels are reducing emissions from ocean-going vessels as well.
EPA is taking action to reduce emissions caused by Aircraft. In 2016, EPA finalized findings that GHG emissions from certain classes of engines used in aircraft contribute to the air pollution that causes climate change endangering public health and welfare under section 231(a) of the Clean Air Act.
Sulfur in gasoline has been reduced by 90 percent, and sulfur in diesel fuel has been reduced by 99 percent, from pre-regulation levels.

Further reductions in power plant pollution have been achieved by state and EPA efforts to cut interstate air pollution, achieving additional public health benefits and helping downwind states meet health-based air quality standards for fine particles and ozone.


1 Pope, C.A. III, E. Majid, and D. Dockery, 2009. “Fine Particle Air Pollution and Life Expectancy in the United States,” New England Journal of Medicine, 360: 376-386.
2 EPA, Air Toxics Web Site, About Air Toxics. (For the latest information about reducing air toxics, see the webpage, Reducing Emissions of Hazardous Air Pollutants.
4 Mobile emissions estimates are based on modeling runs conducted using the MOVES2010 highway vehicle emissions modeling system and the NONROAD2008 emissions model for nonroad sources, as well as historical and projected activity and emission rate data for aircraft, marine vessels and locomotives.
5 Estimates of the change in national benzene emissions are based on benzene ambient air monitoring data in EPA's Air Quality System (U.S. EPA, 2010), using the subset of benzene monitoring stations that have sufficient data to assess trends since 1994.